To be included: Narrative about the Jim Crow era state-sanctioned but locally determined policies of segregation as is evident in the 2 different hospitals for the white and black populations, the discriminatory care provided by physicians in private practices, and discriminatory public health care policies
Fast Facts & Data
State of North Carolina and Buncombe County collect data based on mortality (life expectancy) and morbidity (major causes of death) and this data is following a similar structure.
Women and Children
- In 2015, Black babies were two times more likely to be born prematurely and four times more likely to have a very low birthweight than White babies (North Carolina State Center for Health Statistics, 2015).
- In 2012, Black mothers were three times more likely to deliver a stillborn fetus than White mothers (Buncombe County Report Card).
Transportation
- 29% of Black households have no access to a vehicle, whereas only 7% of White households have no access to a vehicle (2010 American Community Survey).
- In North Carolina, 21.5% of the total population is Black, yet: 40% of pedestrian crash victims are Black, 32.3% of pedestrian fatalities are Black, and 50% of child pedestrian crash victims are Black (2010 American Community Survey).
Disease Related Risk Factors
- Blacks die 6 years earlier than Whites (North Carolina State Center for Health Statistics, 2013-2015)
- In an aggregate of 2011 – 2015 data, the cancer mortality rate per 100,000 in Buncombe County was 218.9 for Blacks and 155.1 for Whites (North Carolina State Center for Health Statistics, 2011-2015, calculated per 100,000).
Health Care Coverage and Providers
- In 2009 there were 2,374 physicians in hospitals, of which 2,098 were White and 276 were minorities. There were also 20 physicians who did not practice in the hospital. Of those 19 where White and one was a minority (Spires, Samuels, Graham, Cistola, 2014).
- In 2012, 23.1% of Blacks in Buncombe County had no health insurance coverage.
- 15.7% of White adults stated that they were in fair or poor health, while 21.6% of Black adults gave the same statement (Spires, Samuels, Graham, Cistola, 2014).
Data, videos, and more
Infant Mortality
All statistics are shown by death rate — the number of deaths divided by the population group times 1000.
Infant Mortality: Fetal
Sources
- 2012 Stats https://schs.dph.ncdhhs.gov/data/vital/volume1/2012/buncombe.html
- 2013 Stats https://schs.dph.ncdhhs.gov/data/vital/volume1/2013/buncombe.html
- 2014 Stats https://schs.dph.ncdhhs.gov/data/vital/volume1/2014/buncombe.html
- 2015 Stats https://schs.dph.ncdhhs.gov/data/vital/volume1/2015/buncombe.html
- 2016 Stats https://schs.dph.ncdhhs.gov/data/vital/volume1/2016/buncombe.html
Sources
- www.example.com Example thing
- 2012 Stats https://schs.dph.ncdhhs.gov/data/vital/volume1/2012/buncombe.html
- 2013 Stats https://schs.dph.ncdhhs.gov/data/vital/volume1/2013/buncombe.html
- 2014 Stats https://schs.dph.ncdhhs.gov/data/vital/volume1/2014/buncombe.html
- 2015 Stats https://schs.dph.ncdhhs.gov/data/vital/volume1/2015/buncombe.html
- 2016 Stats https://schs.dph.ncdhhs.gov/data/vital/volume1/2016/buncombe.html
Infant Mortality: Infant (3 months – 1 year)
Sources
- 2012 Stats https://schs.dph.ncdhhs.gov/data/vital/volume1/2012/buncombe.html
- 2013 Stats https://schs.dph.ncdhhs.gov/data/vital/volume1/2013/buncombe.html
- 2014 Stats https://schs.dph.ncdhhs.gov/data/vital/volume1/2014/buncombe.html
- 2015 Stats https://schs.dph.ncdhhs.gov/data/vital/volume1/2015/buncombe.html
- 2016 Stats https://schs.dph.ncdhhs.gov/data/vital/volume1/2016/buncombe.html
Major Causes of Death (Morbidity)
Reports Needed:
Will be top 10 diseases for African Americans and the top 10 diseases for Whites.
NC State Health Reports for Each Year
Reports Needed
Data Sources:
NCDHHS:
https://schs.dph.ncdhhs.gov/data/vital.cfm
This statewide report provides annual counts of deaths for specific detailed underlying cause of death (4 digits) and age-race-sex groups. State and county data are presented.
- Detailed Mortality Statistics, North Carolina Residents, 2017
- Detailed Mortality Statistics, North Carolina Residents, 2016
- Detailed Mortality Statistics, North Carolina Residents, 2015
- Detailed Mortality Statistics, North Carolina Residents, 2014
- Detailed Mortality Statistics, North Carolina Residents, 2013
- Detailed Mortality Statistics, North Carolina Residents, 2012
- Detailed Mortality Statistics, North Carolina Residents, 2011
- Detailed Mortality Statistics, North Carolina Residents, 2010
- Detailed Mortality Statistics, North Carolina Residents, 2009
- Detailed Mortality Statistics, North Carolina Residents, 2008
- Detailed Mortality Statistics, North Carolina Residents, 2007
- Detailed Mortality Statistics, North Carolina Residents, 2006
- Detailed Mortality Statistics, North Carolina Residents, 2005
- Archived Reports
Sources
This content needs a source. If you know where it came from and can provide further details, please help us source this content.
Top 10 diseases for African Americans and Whites
Reports still needed: Found in the NC state health report by County
Cancer Rates
Breast Cancer in North Carolina 2010 – 2014
Sources
- University of North Carolina at Asheville undergraduate student research paper by Hailey Johnston –
- National Cancer Institute – Breast cancer in white females in North Carolina
- National Cancer Institute – Breast cancer in Black females in North Carolina
- National Cancer Institute – Breast cancer in all females in North Carolina
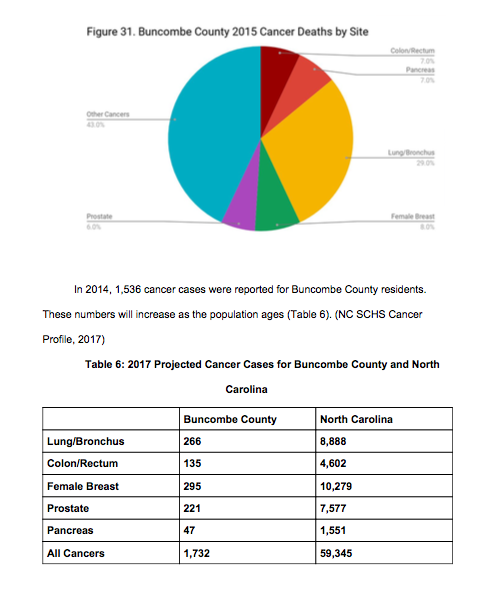
Buncombe County 2015 cancer deaths by site (and 2017 projected)
Prostate Cancer in North Carolina 2010 – 2014
Sources
- Incidence Rate Report for North Carolina by County | Prostate, 2011-2015 | All Races (includes Hispanic), Male, All Ages
-
Incidence Rate Report for North Carolina by County | Prostate, 2011-2015 | All Races (includes Hispanic), Male, All Ages (CSV Download)
incd
- Incidence Rate Report for North Carolina by County | Prostate, 2011-2015 | White Non-Hispanic, Male, All Ages
-
Incidence Rate Report for North Carolina by County | Prostate, 2011-2015 | White Non-Hispanic, Male, All Ages
incd (1)
Stage of disease at diagnosis for cervical cancer in NC in 2014 (African American and White)
This figure analyzes the stage of disease at diagnosis for cervical cancer in North Carolina diagnosed in 2014
Sources
This content needs a source. If you know where it came from and can provide further details, please help us source this content.
Fast Fact: Disease Related Risk Factors
- In an aggregate of 2007 - 2011 data, the cancer mortality rate per 100,000 in Buncombe County was 208 for white males, 145.4 for white females, 288.6 for black males, and 205.3 for black females.
- Of the aggregate data, the greatest disparity between races was for lung cancer. The mortality rate per 100,000 was as follows: white males 67.4; white females, 38.4; black males, 82.0; and black females, 53.5 (WNC Healthy Impact Survey, 2013).
Sources
- WNC Healthy Impact Survey, 2013
North Carolina Cancer Incidence and Mortality Rates (2010-2014)
NC Cancer Incidence Rates 2010 – 2014 (Total Population, White and Black)
Sources
This content needs a source. If you know where it came from and can provide further details, please help us source this content.
NC Cancer Mortality Rates 2010 – 2014 (Total Population, White and Black)
Sources
This content needs a source. If you know where it came from and can provide further details, please help us source this content.
Sources
This content needs a source. If you know where it came from and can provide further details, please help us source this content.
Sources
This content needs a source. If you know where it came from and can provide further details, please help us source this content.
Sources
This content needs a source. If you know where it came from and can provide further details, please help us source this content.
Sources
This content needs a source. If you know where it came from and can provide further details, please help us source this content.
Buncombe County incidence and mortality rate ratios 2010 – 2014
Buncombe County incidence and mortality rate ratios 2010 – 2014 (White & Black)
Sources
This content needs a source. If you know where it came from and can provide further details, please help us source this content.
Buncombe County incidence and mortality rate ratios 2010 – 2014 (White Males & Black Males)
Sources
This content needs a source. If you know where it came from and can provide further details, please help us source this content.
Buncombe County incidence and mortality rate ratios 2010 – 2014 (White Females & Black Females)
Sources
This content needs a source. If you know where it came from and can provide further details, please help us source this content.
Buncombe County incidence and mortality rates 2010 – 2014
Buncombe County cancer incidence rates 2010 – 2014 (Total Population, White & Black)
Sources
This content needs a source. If you know where it came from and can provide further details, please help us source this content.
Buncombe County cancer mortality rates 2010 – 2014 (Total Population, White & Black)
Sources
This content needs a source. If you know where it came from and can provide further details, please help us source this content.
Buncombe County cancer incidence rates 2010 – 2014 (Males, White & Black)
Sources
This content needs a source. If you know where it came from and can provide further details, please help us source this content.
Buncombe Male Cancer Mortality Rates 2010 – 2014 (Males, Black and White)
Sources
This content needs a source. If you know where it came from and can provide further details, please help us source this content.
Sources
This content needs a source. If you know where it came from and can provide further details, please help us source this content.
Buncombe Female Cancer Mortality Rates 2010 – 2014 (Female, White and Black)
Sources
This content needs a source. If you know where it came from and can provide further details, please help us source this content.
Highlighted Areas of Concern
- Lack of access for African Americans to culturally competent and adequate mental health care
- Lack of access for African Americans to non-traditional medicine and care
- On the list of the top 10 reasons for death for African Americans is violence. This is a public health concern, what can be done about this? How does this link to criminal justice?
- Each of the other pages of the website are Social Indicators of Health and therefore heavily influence the health of African Americans in Asheville. This fact needs to be highlighted and referenced when addressing healthcare needs.
- Medicaid and Medicare and insurance coverage
Factors of Resiliency and Self-Sufficiency
- Local churches and grassroots programs offer various educational and support programs that promote healthcare. This includes programs like cooking, weight reduction, medical screenings, etc. Reports are need to be highlight and amplify these efforts.
- Mutual Aid Societies — Neighbors and friends and churches and families would contribute to a common pool of money and that money was to be used for major illnesses and burials. These don’t currently exist.
- Multi generational households were characterized by grandparents and great grandparents living in the same homes and being cared for when infirmed by younger generations and also caring for children whose parents were not present. Traditional systems of care appear to be under severe stress at this time as is evident by one of the the fastest growing populations of homeless are African American elders.
Areas for further research
- Reports need for the other 7 top 10 killers (causes for morbidity) of African Americans in Buncombe County and illustrate the disparities between Black and white
- Mental health data
- Determinants of health such as environmental conditions and nutrition
- Elder care
- Data by race, gender, and age of the health of African Americans in Western NC and Buncombe County based on Medicaid and Medicare and supplemental insurance coverage
- Data by race and gender of users of Wic and food assistance meeting (or not meeting) the nutritional needs of the community