Archives: Visualizations
We believe that interactive data has the power to engage the community and create positive change. Our goal is to bring research to the public in a way that can help people understand the numbers and make their own contributions.
Showing 99 visualizations of 99 total.
Paginated by 10.
Created
Mathematical Proficiency
- Just 19.9% of black students in Grades 3 through 8 in Asheville City Schools were considered as having a proficient understanding of mathematics. That's a decrease of 42.4% from the prior year.
- 75.3% of white students in Grades 3 through 8 in Asheville City Schools were considered as having a proficient understanding of mathematics. That's a decrease of approximately 20% from the prior year.
Sources
- 2012 - 13 School Year, NCPublicSchools http://accrpt.ncpublicschools.org/app/2013/disag/
Created
Reading Comprehension
- In Grades 3 through 8 in Asheville City Schools, 19.5% of black students, 77.2% of white students, and 42.9% of Hispanic students reached proficient or advanced reading levels.
- 11.1% percent of black students in the eighth grade at Asheville Middle reached proficient or advanced reading levels.
Sources
- 2012 - 13 School Year, NCPublicSchools.org http://accrpt.ncpublicschools.org/app/2013/disag/
Created
Early Childhood Education
- During the 2011 - 12 school year, Asheville City Schools provided preschool education to 140 students, of which 58.6% were black, 9.3% were Hispanic, and 30.7% were white.
Sources
- U.S. Department of Education Office for Civil Rights https://ocrdata.ed.gov/Page?t=d&eid=29089&syk=6&pid=918
Created
Stage of disease at diagnosis for cervical cancer in NC in 2014 (African American and White)
This figure analyzes the stage of disease at diagnosis for cervical cancer in North Carolina diagnosed in 2014
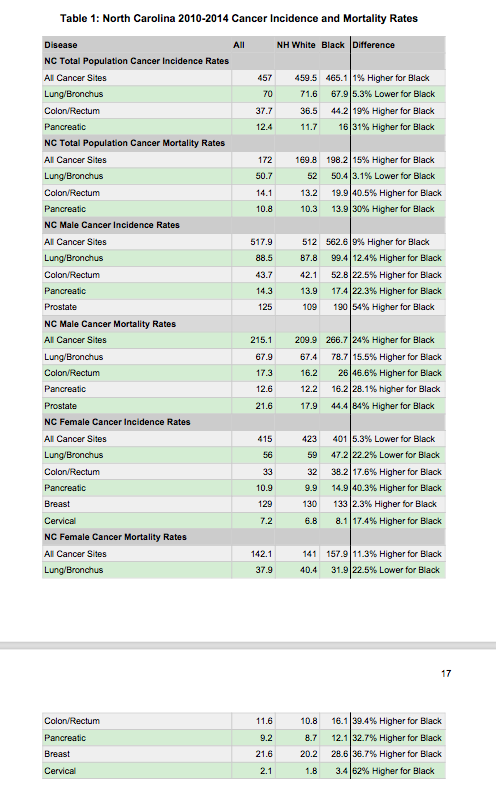
Student Paper:
Cancer Disparities in Buncombe County, North Carolina
Sources
This content needs a source. If you know where it came from and can provide further details, please help us source this content.
Created
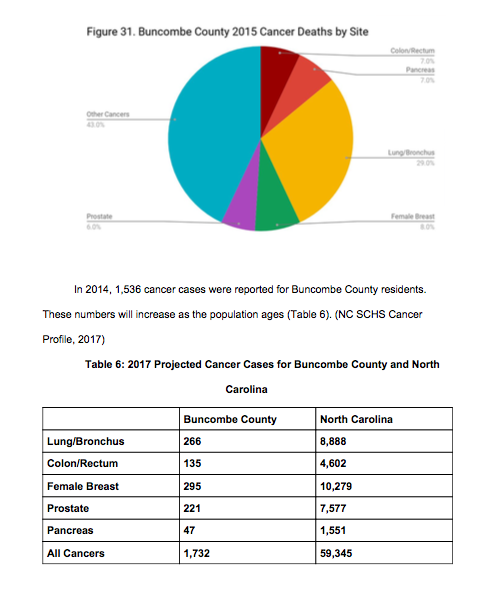
Buncombe County 2015 cancer deaths by site (and 2017 projected)
Buncombe County 2015 Cancer Deaths by Site / 2017 Projected Cancer Cases for Buncombe County and North Carolina
Created
2015 Cancer death comparison – Buncombe County and North Carolina
2015 percent of cancer deaths in Buncombe County compared to 2015 percent of cancer deaths in North Carolina.
Created
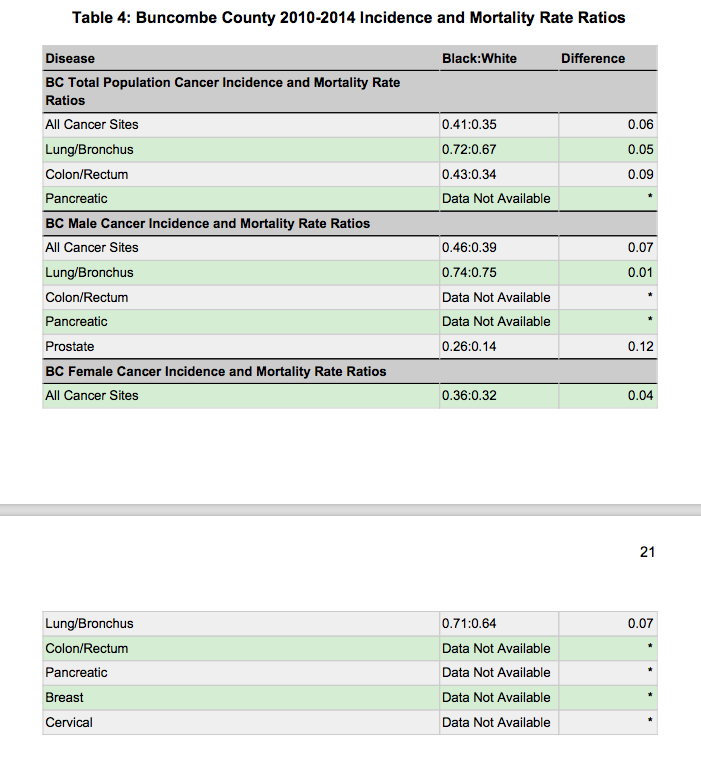
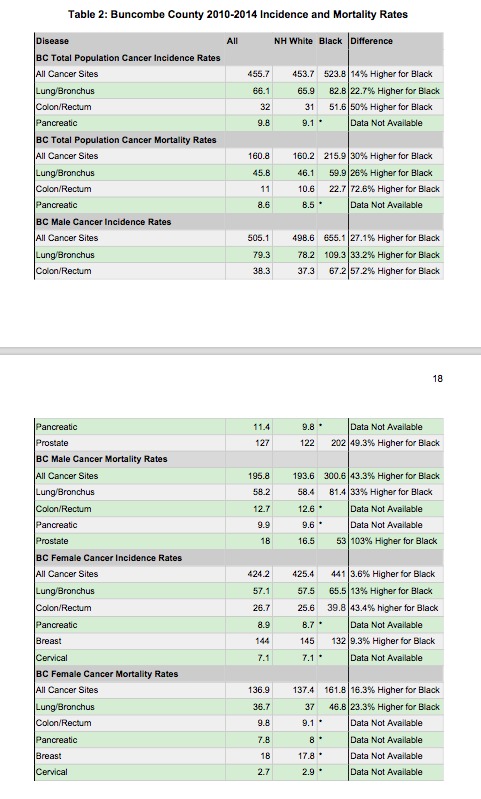
Buncombe County incidence and mortality rate ratios 2010 – 2014
Created
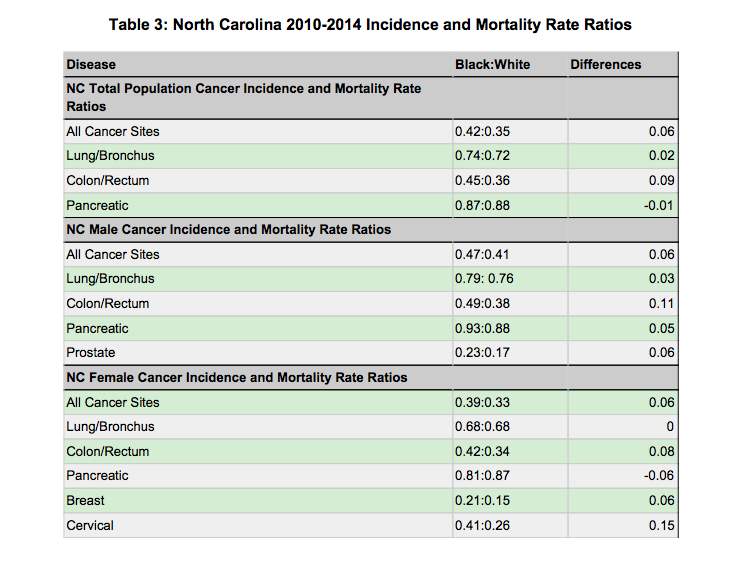
North Carolina incidence and mortality rate ratios 2010 – 2014
Created