Archives: Visualizations
We believe that interactive data has the power to engage the community and create positive change. Our goal is to bring research to the public in a way that can help people understand the numbers and make their own contributions.
Average EOG test score by female ethnicity
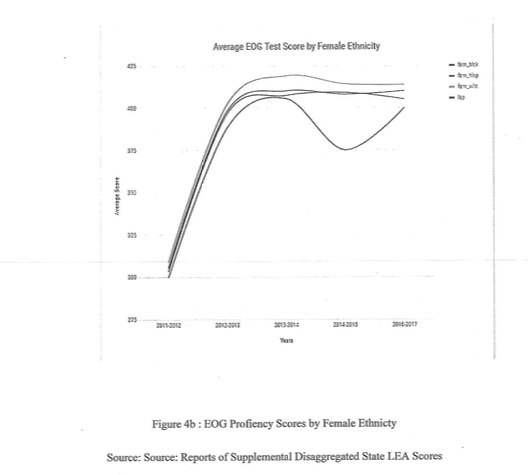
Sources
- NC Public Schools accountability and testing results http://www.ncpublicschools.org/accountability/reporting/
End-of-grade proficiency test scores (LEP vs Non-LEP)
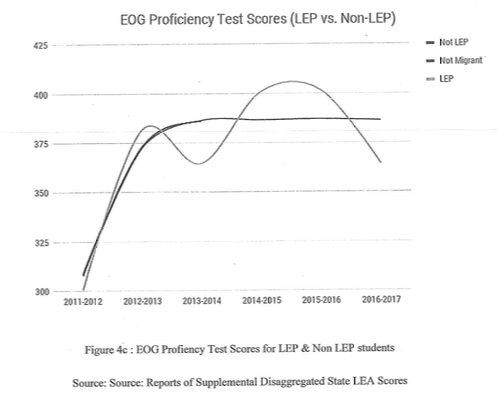
Sources
- Reports of supplemental disaggregated state LEA scores http://www.ncpublicschools.org/accountability/reporting/leaperformancearchive/
End of Grade Proficiency Scores for ACS Grades 5-8 2007-2018
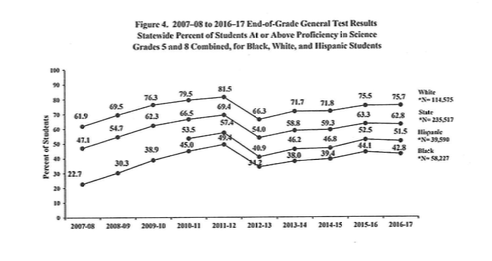
Sources
- NC Public Schools accountability and testing results http://www.ncpublicschools.org/accountability/reporting/
Fast Facts: Public Housing
- There are ten public housing communities with 3,100 residents; 71.8% of these residents are black.
- 1,350 families receive funding from Housing Choice Vouchers (Section 8).
Sources
This content needs a source. If you know where it came from and can provide further details, please help us source this content.
Fast Facts: Home Ownership
- 63% of black families rent their homes, and 37% own their homes (American Community Survey 2012).
- 48% of white families rent their homes, and 52% own their homes (American Community Survey 2012).
- The median sale price for a home in Asheville as of May, 2014 is $212,000.
Sources
- American Community Survey https://www.census.gov/programs-surveys/acs/data.html
Housing Choice Vouchers
Sources
This content needs a source. If you know where it came from and can provide further details, please help us source this content.
Public Housing
Sources
This content needs a source. If you know where it came from and can provide further details, please help us source this content.
Median Sale price
Sources
This content needs a source. If you know where it came from and can provide further details, please help us source this content.
Home Ownership – Rentals
Sources
This content needs a source. If you know where it came from and can provide further details, please help us source this content.
Home Ownership
Sources
- American Community Survey 2012 https://www.census.gov/programs-surveys/acs/data.html