Archives: Visualizations
We believe that interactive data has the power to engage the community and create positive change. Our goal is to bring research to the public in a way that can help people understand the numbers and make their own contributions.
Showing 99 visualizations of 99 total.
Paginated by 10.
Created
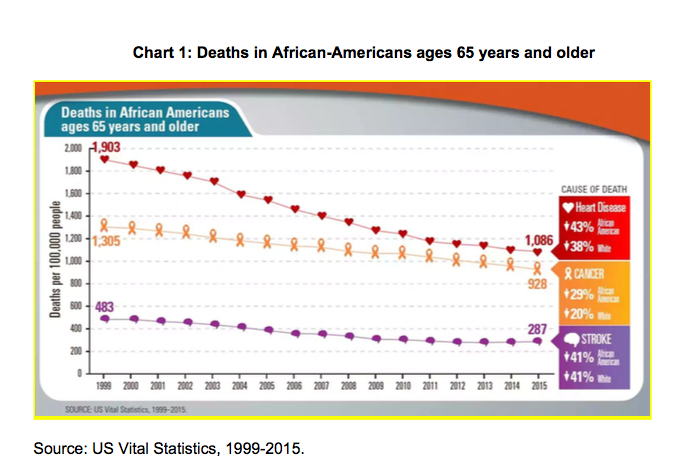
Deaths in African Americans Age 65 and Older
This figure shows deaths per 100,000 people broken down by cause of death for the time period of 1999 through 2015.
Sources
- US Vital Statistics, 1999-2015
Created
Fast Fact: Health Care Coverage and Providers
- In 2009 there were 2,374 physicians in hospitals, of which 2,098 were white and 276 were minorities. There were also 20 physicians who did not practice in the hospital. Of those 19 where white and one was a minority (Spires, Samuels, Graham, Cistola, 2014).
- In 2012, 23.1% of blacks in Buncombe County had no health insurance coverage.
- 15.7% of white adults stated that they were in fair or poor health, while 21.6% of black adults gave the same statement (Spires, Samuels, Graham, Cistola, 2014).
Sources
- Spires, Samuels, Graham, Cistola, 2014
- Spires, Samuels, Graham, Cistola, 2014
Created
Fast Fact: Disease Related Risk Factors
- In an aggregate of 2007 - 2011 data, the cancer mortality rate per 100,000 in Buncombe County was 208 for white males, 145.4 for white females, 288.6 for black males, and 205.3 for black females.
- Of the aggregate data, the greatest disparity between races was for lung cancer. The mortality rate per 100,000 was as follows: white males 67.4; white females, 38.4; black males, 82.0; and black females, 53.5 (WNC Healthy Impact Survey, 2013).
Sources
- WNC Healthy Impact Survey, 2013
Created
Fast Facts: Transportation & Health Care
- 29% of black households have no access to a vehicle, whereas only 7% of white households have no access to a vehicle (2010 American Community Survey).
- In North Carolina, 21.5% of the total population is black, yet: 40% of pedestrian crash victims are black, 32.3% of pedestrian fatalities are black, and 50% of child pedestrian crash victims are black (2010 American Community Survey).
Sources
- 2010 American Community Survey
- 2010 American Community Survey
Created
Fast Facts: Healthcare – Women and Children
- In 2012, black mothers were three times more likely to deliver a stillborn fetus than white mothers (Buncombe County Report Card).
- From 2008 to 2012, 15.3% of black babies were born with low, or very low, birth weights, compared to 7.3% of white babies born with low or very low birth weights (2014 NC County Health Data Book).
Sources
- Buncombe County Report Card
- 2014 NC County Health Data Book
Created
Traffic Stops
- 39% of men stopped by APD are black; 16% of men given citations during a traffic stop are black; 32% of men who are arrested during a traffic stop are black (NC Department of Justice).
- 21% of women stopped by APD are black; 14% of women given citations during a traffic stop are black; 14% of women who are arrested during a traffic stop are black (NC Department of Justice).
Sources
This content needs a source. If you know where it came from and can provide further details, please help us source this content.
Created
Fast Facts: Death Row
- Buncombe County convicted nine individuals to death row in 2009. One third of these individuals were black, even though blacks comprised just 7.1% of Buncombe County's population at the time (NC Department of Corrections and 2010 United States Census).
- In 2010, 82 of 159 individuals on North Carolina's death row were black. 22% named Buncombe County as their county of residence. Black men comprised less than 4% of the county's population (NC Department of Corrections and 2010 United States Census).
Sources
This content needs a source. If you know where it came from and can provide further details, please help us source this content.
Sources
This content needs a source. If you know where it came from and can provide further details, please help us source this content.
Created
2011 – 2017 Number of dropouts Asheville City Schools by ethnicity (White & Black)
Sources
- NC Department of Instruction http://www.ncdpi.wikispaces.net/
Created
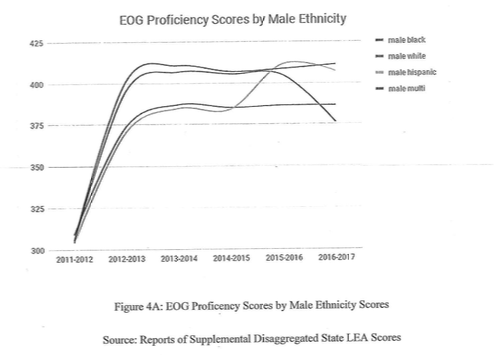
EOG proficiency scores by male ethnicity
EOG proficiency scores by male ethnicity
Sources
- NC Public Schools accountability and testing results http://www.ncpublicschools.org/accountability/reporting/